
Gold Market History Guide: Trends That Shape Prices
Table of Contents
- Why Gold Market History Still Matters in 2026
- Gold Market History Timeline: From the Gold Standard to Record Highs
- How to Analyze Gold Market Cycles Using Historical Data
- Key Factors Affecting Gold Market Volatility
- Gold vs Bitcoin Historical Performance: An Honest Comparison
- Common Mistakes When Reading Gold Price Charts
- How to Choose a Reliable Gold Market History Guide
- Conclusion: Using History to Inform Your Next Move
- Frequently Asked Questions
Last Updated: September 8, 2026
Gold is often described as a store of value, but that label only makes sense when you understand the full arc of its market history. The price of gold today is the product of decades of monetary policy shifts, inflationary shocks, and geopolitical crises. For anyone exploring a gold market history guide, the real value lies in learning how those historical forces repeat themselves. My Gold Book offers an insightful and comprehensive guide titled ‘GOLD: The Most Precious of Metals,’ authored by Douglas Ginter, designed to help curious readers make informed decisions about collecting and investing in gold.
The central tension in gold investing is this: gold has no cash flow, no earnings, and no yield. Its price is driven almost entirely by perception, fear, and monetary conditions. This guide covers the timeline from the gold standard to record highs, the key factors that drive volatility, an honest look at gold versus Bitcoin historical performance, and common mistakes investors make when reading price charts.
Why Gold Market History Still Matters in 2026
Gold market history is not a dusty collection of old data points; it is a practical tool for navigating current economic uncertainty. The same macro forces that pushed gold to its early highs, such as inflation eroding purchasing power and central banks expanding the money supply, are still active in 2026. Understanding the patterns of previous bull and bear markets helps you stop reacting emotionally to short-term swings and start making decisions based on cyclical trends that have repeated for decades.
A common mistake is treating gold as a speculative trade rather than a long-term hedge. Data from past cycles shows gold performs best during periods of negative real returns in other assets. You are not betting on a company’s earnings; you are betting on the erosion of fiat currency and the persistence of market volatility. A reliable gold market history guide will teach you to measure success in decades, not days.
Gold Market History Timeline: From the Gold Standard to Record Highs
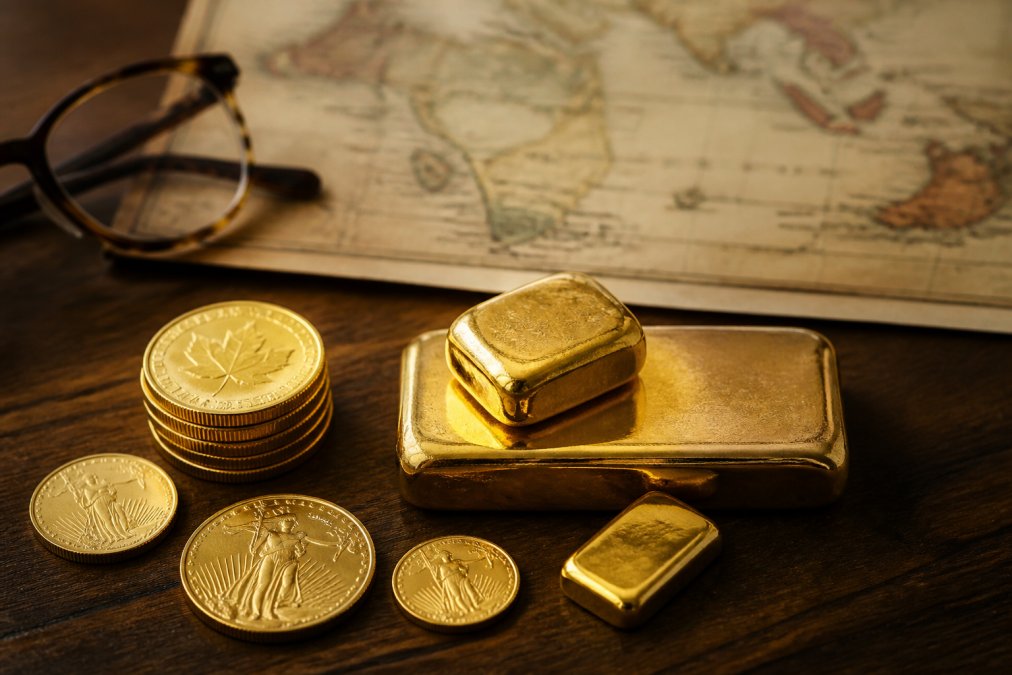
The modern gold market history timeline begins with a single, decisive break from the past. Understanding these inflection points is essential for interpreting the spot price movements you see today.
1971: The End of Bretton Woods
The most important date in modern gold market history is August 15, 1971. President Nixon ended the convertibility of the dollar into gold, severing the last link between currency and the precious metal (federalreservehistory.org). This decision, known as the Nixon Shock, transformed gold from a fixed monetary anchor into a freely floating commodity. Prior to this, the spot price was fixed at $35 per troy ounce; after the float, the market determined the price. This shift laid the groundwork for every bull market that followed.
1980: The First Major Spike
The first major test of the free-floating gold market came in January 1980. Driven by stagflation, oil shocks, and the Iranian hostage crisis, gold surged to roughly $850 per troy ounce (macrotrends.net). The spike was short-lived; gold entered a two-decade bear market as interest rates climbed and inflation was tamed. The lesson is that gold’s price is heavily influenced by real interest rates; when rates rise, holding a non-yielding asset becomes less attractive.
2008-2012: Quantitative Easing and the $1,900 Peak
The next major chapter in gold market history was written during the Global Financial Crisis. In response to the collapse of 2008, central banks launched massive quantitative easing programs, fueling a historic rally. Gold broke through the $1,900 per troy ounce mark in 2011, a record at the time (macrotrends.net). This period demonstrates the direct correlation between monetary policy and gold prices: when central banks print money, investors flock to gold to protect purchasing power.
2020-2025: Pandemic, Inflation, and New Highs
The most recent bull run in gold market history began with the COVID-19 pandemic. Emergency stimulus packages and supply chain disruptions created a perfect storm for inflation. Gold broke its previous records, consistently trading above $2,000 per troy ounce and reaching new historical highs in 2024 and 2025. This phase has been characterized by strong central bank buying, particularly from emerging economies diversifying reserves away from the dollar, and by ongoing geopolitical conflicts reinforcing gold’s safe-haven status.
How to Analyze Gold Market Cycles Using Historical Data
Learning how to analyze gold market cycles requires separating the signal from the noise. Daily fluctuations are often meaningless; long-term cycles reveal the real story. Gold moves in distinct bull and bear phases that can last for years or even decades, and identifying these phases is the first step to building a sound strategy.
Spot Price vs. Inflation-Adjusted Price
A critical distinction in any gold market history analysis is between the spot price and the inflation-adjusted price. The spot price is the current market value in today’s dollars; the inflation-adjusted price, or “real” price, accounts for the erosion of purchasing power over time. For instance, the 1980 high of $850 was actually much higher in real terms than the 2011 peak of $1,900. Viewing historical highs through inflation-adjusted data prevents flawed comparisons across eras.
Reading Bull and Bear Phases
Gold’s cyclical trends are defined by long periods of accumulation followed by sharp rallies. A bull market is typically driven by loose monetary policy, falling interest rates, and rising inflation expectations; a bear market occurs when the Federal Reserve tightens policy and real rates rise. When analyzing charts, look for the macro trend rather than short-term corrections. Dollar-cost averaging into gold during a bear phase is a proven strategy for building a position at a lower average cost.
Key Factors Affecting Gold Market Volatility
Gold market volatility is not random; it is a direct response to a handful of powerful macroeconomic forces. Understanding these factors allows you to anticipate moves rather than chase them. While supply and demand play a role in the physical market, price discovery is dominated by financial flows.
Monetary Policy and Interest Rates
The single largest driver of gold prices is monetary policy, specifically the level of real interest rates. When the Fed cuts rates or engages in quantitative easing, the opportunity cost of holding gold falls, making it more attractive; when it raises rates to fight inflation, gold often struggles. This inverse relationship is well-documented across decades of data. A single hint of a policy shift can trigger significant volatility in the precious metals sector.
Click Here To Order Your Copy →
Geopolitical Instability and Safe-Haven Demand
Gold’s reputation as a safe-haven asset means it benefits directly from global uncertainty. Wars, political upheaval, and economic sanctions drive investors toward assets not tied to any single government. When instability rises, we typically see an immediate bid under the gold price, but these rallies can fade quickly if the crisis resolves. Long-term, sustained moves are reserved for monetary factors, while geopolitical events often create shorter, sharper spikes that are difficult to trade profitably.
Gold vs Bitcoin Historical Performance: An Honest Comparison
For investors weighing modern digital assets against traditional metals, the gold vs Bitcoin historical performance comparison is a frequent starting point. The honest answer is that they are fundamentally different assets serving different purposes. Gold has thousands of years of history as a monetary metal and a hedge against systemic risk. Bitcoin, launched in 2009, has a much shorter track record but has delivered extraordinary returns during its bull phases.
The key difference lies in volatility and maturity. Gold is a mature, relatively stable asset that moves slowly in response to macroeconomic trends; Bitcoin is a young, highly speculative asset with extreme price swings. While Bitcoin has outperformed gold on a pure return basis over the last decade, it has also suffered drawdowns of 80% or more. For most investors, gold serves as a stabilizing force, while Bitcoin is often treated as a high-risk growth bet. A balanced view recognizes that you do not have to choose one exclusively; they can coexist with different roles.
Common Mistakes When Reading Gold Price Charts
Reading a gold price chart seems simple, but several common mistakes lead to poor conclusions. The first error is ignoring the time frame: a chart of the last five years looks very different from one of the last fifty. Zooming out reveals long-term cyclical trends; zooming in only shows short-term noise. The second mistake is comparing nominal prices without adjusting for inflation, which leads to false conclusions about historical highs and lows.
Another frequent error is misinterpreting volume and open interest data, which are more relevant to commodity trading than long-term investing. For the average investor, psychological factors are the biggest trap: watching the price drop daily can provoke panic selling even when the long-term thesis remains intact. The best defense is to define your strategy before you look at the chart. If you are a long-term holder using dollar-cost averaging, the daily chart is largely irrelevant.
How to Choose a Reliable Gold Market History Guide
Not all gold market history guides are created equal. Many online sources are either too superficial or too biased toward a single narrative. A reliable guide should offer a balanced assessment of gold, covering its role as a commodity, its monetary history, and its cultural significance, and should address modern comparisons such as gold versus Bitcoin without claiming one is universally superior.
When evaluating a resource, ask whether the author has a clear research methodology and presents multiple perspectives. The best guides acknowledge the arguments against owning gold, such as its lack of yield and storage costs, as well as the arguments for it. For those seeking a comprehensive resource, My Gold Book’s “GOLD: The Most Precious of Metals” by researcher Douglas Ginter covers the history, supply and demand, and the major uses of gold. It is designed for those curious about the precious metal, providing a balanced view that does not assume prior knowledge.
| Guide Feature | Why It Matters | What to Look For |
|---|---|---|
| Historical Scope | Provides context for current prices | Covers 1971 to present, not just recent years |
| Balanced Perspective | Helps avoid biased advice | Discusses both pros and cons of ownership |
| Modern Comparisons | Relevant for today’s investors | Includes analysis of gold vs Bitcoin |
| Author Credentials | Establishes trust and authority | Researcher with a clear, cited methodology |
| Accessibility | Keeps beginners engaged | Explains terms without being overly technical |
Conclusion: Using History to Inform Your Next Move
The patterns in gold market history offer a roadmap, but you still have to drive. Use historical data to frame your expectations, not to predict the next price tick. Gold is a long-term hedge against inflation and currency devaluation, not a get-rich-quick scheme. By understanding monetary policy drivers, geopolitical instability, and the psychological factors that cause volatility, you can approach gold with confidence rather than fear.
Making a decision about gold requires a solid foundation of knowledge. A comprehensive guide, like the one offered by My Gold Book, provides the balanced research needed to cut through the noise and answer your questions about inflation, collecting, and the true value of this precious metal.
Gold’s story is long, but your learning curve does not have to be. The challenge is finding a resource that provides a fair, comprehensive look at the metal. My Gold Book offers an insightful and comprehensive guide titled ‘GOLD: The Most Precious of Metals,’ authored by Douglas Ginter, which delivers expert research to help readers make informed decisions about collecting and investing in gold. Click Here To Order Your Copy and build your understanding on a foundation of balanced, expert research.
Frequently Asked Questions
How much was 1 oz of gold worth 10 years ago?
Ten years ago, in early 2016, the spot price of gold hovered around $1,100 per troy ounce. That period marked the end of a multi-year bear market following the 2011 peak near $1,900. Comparing that price to today’s levels shows how monetary policy and inflation concerns have driven gold’s value upward, which is a core lesson in any gold market history guide.
Is gold market history a reliable indicator for future performance?
History does not predict exact prices, but it reveals cyclical trends worth studying. Gold has moved through clear bull and bear phases tied to interest rates, quantitative easing, and geopolitical instability. Understanding these cycles helps you set realistic expectations and time entries using dollar-cost averaging rather than chasing spikes. A good guide on gold market history teaches these patterns without promising specific future outcomes.
How does gold vs bitcoin historical performance compare?
Gold has roughly 50 years of modern free-market price history, while Bitcoin has just over 15 years. Gold shows steady cyclical trends with lower volatility, whereas Bitcoin delivers faster gains but deeper drawdowns. For example, gold’s 2020-2025 rally was driven by inflation and central bank buying, while Bitcoin’s moves track liquidity cycles more sharply. Your choice depends on whether you prioritize stability or growth potential.
What is the best way to learn about gold market cycles?
Start by studying a chart that plots spot price against inflation-adjusted price, since that separates real gains from currency devaluation. Then identify the major turning points: 1980, 2001, 2011, and 2020. Each aligns with a shift in monetary policy or a crisis event. A structured book like ‘GOLD: The Most Precious of Metals’ walks through these cycles with context that raw charts alone cannot provide.