
Gold Supply and Demand Explained: A 2026 Guide
Table of Contents
- What Is Gold Supply and Demand?
- Primary Sources of Gold Supply
- Major Sectors Driving Gold Demand
- Factors Affecting Gold Prices
- How to Analyze Gold Market Trends
- The Role of OTC Markets and Futures Trading
- Gold ETFs and Physical Liquidity
- Conclusion
Last Updated: August 15, 2026
What Is Gold Supply and Demand?
Gold supply and demand represents the fundamental dynamic that determines gold’s price in global markets. Supply refers to the total amount of gold available for purchase, including newly mined gold, recycled bullion, and existing stockpiles held by central banks and investors. Demand encompasses all the reasons people and institutions want to own gold: jewelry fabrication, investment portfolios, central bank reserves, industrial applications, and safe-haven purchases during economic uncertainty.
This balance between how much gold exists and how badly people want it drives everything from daily spot prices to long-term investment trends. When demand outpaces supply, prices typically rise. When supply exceeds demand, prices tend to fall. Understanding this relationship is essential for anyone considering gold as an inflation hedge or long-term investment, which is why My Gold Book dedicates substantial analysis to these market dynamics.
The gold market operates across multiple channels simultaneously. Physical gold trades in over-the-counter (OTC) markets where dealers buy and sell bullion bars and coins directly. Futures markets allow traders to speculate on future prices without owning physical metal. Exchange-traded funds (ETFs) give retail investors exposure to gold without storing it themselves. Each channel influences the others, creating a complex web of price discovery where supply and demand constantly interact.
Primary Sources of Gold Supply
Mine production and scrap recycling form the backbone of gold supply. Understanding where new gold enters the market helps explain why supply constraints can trigger price movements and why certain geopolitical events affect availability.
Mine Production and Output
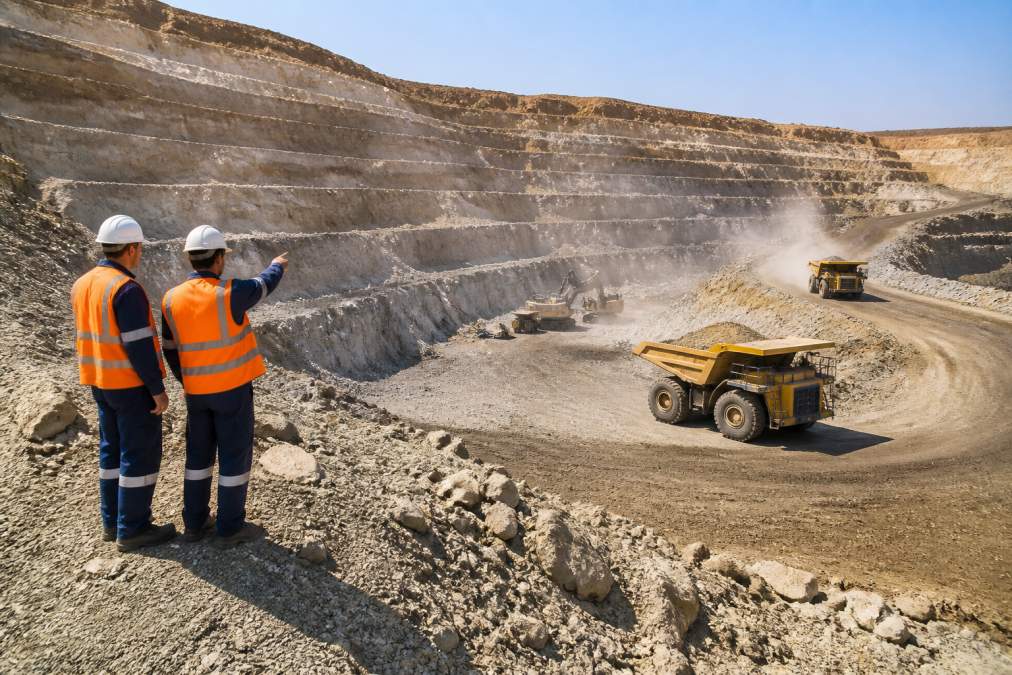
New gold from mining operations accounts for roughly half of annual supply in most years. Major mining regions include Australia, China, Russia, Canada, and Peru, with production measured in metric tons annually. When a major mine closes due to geopolitical instability, environmental regulations, or operational failure, global supply tightens immediately.
Mining output fluctuates based on ore grades, extraction costs, and regulatory environments. High real interest rates can discourage mining expansion since projects require years of capital investment before generating returns. Conversely, when interest rates fall and gold prices rise, mining companies accelerate production, increasing supply.
The time lag between exploration and production creates supply inertia. A newly discovered deposit takes 5-10 years to develop into a producing mine. This delay means supply cannot quickly respond to sudden demand spikes, which is why price volatility often exceeds what current supply-demand imbalances alone would suggest.
Scrap Recycling and Bullion Recovery
Scrap recycling supplies roughly 25-30% of annual gold availability. This comes from old jewelry, dental work, electronic components, and damaged coins melted down and refined into pure bullion. When gold prices rise sharply, more people sell old jewelry and scrap, increasing recycled supply. When prices fall, fewer people bother recycling, reducing this supply source.
Recycling responds faster than mine production to price signals. A jeweler can melt scrap and sell refined gold within weeks, whereas opening a new mine takes years. This flexibility makes recycled supply a crucial price stabilizer during market swings.
Central banks also release gold from reserves through sales, though this happens rarely and only under specific circumstances. These institutional releases can move markets significantly when they occur, adding another layer to supply dynamics that individual investors must monitor.
Major Sectors Driving Gold Demand
Gold demand divides into distinct categories, each responding to different economic signals and market conditions. Jewelry dominates by volume, but investment demand drives price volatility.
Jewelry Fabrication and Consumer Purchases
Jewelry fabrication accounts for roughly 50% of annual gold demand globally. Consumers in Asia, the Middle East, and India drive much of this demand, treating gold as both adornment and portable wealth. Cultural traditions, wedding customs, and wealth-preservation habits shape jewelry demand patterns across regions.
Jewelry demand proves relatively price-inelastic in the short term, people buy gold jewelry for cultural reasons regardless of modest price fluctuations. However, sustained price increases eventually reduce jewelry demand as consumers substitute with alternative metals or simply purchase less. When gold reaches historically high prices, jewelry fabrication slows noticeably.

Investment Demand and Safe-Haven Demand
Investment demand, purchases of bullion bars, coins, and gold ETFs, accounts for roughly 30-35% of annual demand. This category proves highly price-sensitive and volatile. When stock markets crash or currency values collapse, investors flee to gold as a safe-haven asset, driving demand and prices upward simultaneously.
Real interest rates heavily influence investment demand. When real interest rates (nominal rates minus inflation) turn negative, gold becomes attractive because it preserves purchasing power without offering interest payments. Conversely, when real interest rates rise, investors can earn returns from bonds and savings accounts, reducing gold’s appeal.
Market sentiment and geopolitical instability trigger sudden shifts in investment demand. Wars, trade disputes, or central bank policy uncertainty can spark buying pressure within days. This psychological component of demand makes gold prices jump in ways that pure supply-demand math cannot predict.
Gold ETFs have amplified investment demand volatility by making gold ownership frictionless. Investors can buy or sell gold exposure with a single stock trade, creating rapid capital flows that move prices sharply. When ETF inflows accelerate, they absorb significant supply, tightening physical liquidity and supporting prices.
Central Bank Reserves and Industrial Applications
Central banks hold gold as reserve assets, typically around 15-20% of global demand. These institutions buy gold during currency crises or when diversifying away from foreign currencies. Central bank net purchases have increased substantially since the 2008 financial crisis, providing a steady demand floor that supports prices.
Industrial applications consume roughly 5-10% of annual gold demand. Electronics manufacturers use gold in circuit boards and connectors due to its conductivity and corrosion resistance. Dentistry, aerospace, and pharmaceutical industries also consume gold. Industrial demand remains relatively stable and price-insensitive since gold represents a small cost component in finished products.
Factors Affecting Gold Prices
Multiple economic and geopolitical forces shape how supply and demand interact to determine gold prices. These factors create the market volatility that makes gold both attractive and risky for investors.
Real Interest Rates and Currency Debasement
Real interest rates represent the single most powerful driver of gold prices over medium timeframes. When central banks raise rates and inflation falls, real interest rates climb, making gold less attractive since investors can earn returns elsewhere. When real interest rates turn negative, inflation exceeds nominal interest rates, gold becomes a compelling alternative to bonds and savings accounts.
Currency debasement concerns also drive gold demand. When governments print excessive money or run large deficits, investors worry about inflation and currency collapse. These fears push capital into gold as a hedge against currency weakness. The relationship between monetary policy and gold prices proves remarkably consistent across decades and markets.
Inflation expectations matter separately from actual inflation. If investors believe inflation will accelerate, they buy gold in anticipation, pushing prices higher before inflation actually arrives. This forward-looking behavior creates price movements that precede economic data by months.
Click Here To Order Your Copy →
Geopolitical Instability and Market Sentiment
Wars, trade disputes, political crises, and regulatory threats trigger safe-haven demand for gold. During the 2022 Russia-Ukraine conflict, gold prices spiked as investors sought protection from market uncertainty. During trade wars or sanctions regimes, gold demand accelerates as investors fear economic disruption.
Market sentiment and psychological factors amplify these movements. When fear dominates investor thinking, gold becomes the ultimate safe-haven asset. When confidence returns, investors rotate back into stocks and bonds, reducing gold demand. Tracking sentiment through options markets, fund flows, and positioning data helps predict price movements.
Supply chain constraints occasionally amplify price movements. Refinery disruptions, shipping delays, or sanctions on major producing countries can tighten physical supply even when global production levels remain adequate. These temporary supply shocks create price spikes that reverse once supply normalizes.
How to Analyze Gold Market Trends
Serious investors need systematic approaches to track gold supply, demand, and prices. This requires monitoring specific data sources and understanding market structure.
Tracking Supply and Demand Data
The World Gold Council publishes quarterly reports detailing mine production, recycling volumes, and demand by sector. These reports provide the most reliable supply-demand data available to retail investors. Mining company earnings reports and production guidance offer early signals about future supply trends.
Central bank purchase announcements should be tracked through official sources and financial news outlets. When major central banks announce gold purchases, the market typically responds within hours. Setting up alerts for central bank statements helps investors react quickly to policy shifts.
Jewelry demand data lags actual sales by several months, making it less useful for real-time trading. However, tracking jewelry demand trends helps explain longer-term price movements. When jewelry demand weakens, investment demand must strengthen for prices to hold steady, or prices will fall.
Understanding Price Discovery and Market Equilibrium
The London Bullion Market Association (LBMA) sets the daily fixing price that anchors global gold trading. This price emerges from supply-demand interactions across OTC dealers, futures markets, and ETF flows. Understanding how these channels interact helps explain price volatility.
Futures contracts trade 24 hours daily on exchanges like COMEX, allowing continuous price discovery even when physical markets close. Large institutional traders use futures to position ahead of supply-demand shifts, creating price movements that precede physical market activity.
Spot prices reflect current market equilibrium, the price at which willing buyers and sellers meet right now. Forward prices (prices for future delivery) can diverge from spot prices when supply concerns exist or when interest rates create carrying cost differences. Watching the spread between spot and forward prices reveals market stress.
The Role of OTC Markets and Futures Trading
The over-the-counter gold market dwarfs exchange-traded volumes, with trillions of dollars in daily transactions. OTC dealers facilitate direct transactions between central banks, mining companies, jewelry manufacturers, and large investors. This market operates with minimal regulation compared to stock exchanges, creating both efficiency and opacity.
OTC trading allows large positions to move without the price impact that would occur on regulated exchanges. A central bank can buy hundreds of metric tons through OTC channels with minimal market disruption. This market depth protects against dramatic price swings from large transactions, but it also means retail investors cannot access OTC pricing directly.
Futures markets on COMEX provide the most transparent price discovery. Here, speculators and hedgers trade contracts representing future gold delivery. Large speculative positioning can amplify price movements, particularly when trends reverse and speculators exit positions simultaneously. Tracking commercial versus speculative positioning through Commitment of Traders (COT) reports helps identify potential price inflection points.
Gold ETFs and Physical Liquidity
Gold ETFs revolutionized retail access to gold ownership, but they also created new dynamics affecting physical liquidity. When ETF inflows accelerate, fund managers must purchase physical gold to back new shares, absorbing supply and supporting prices. When outflows occur, ETF redemptions release gold back into physical markets.
Large ETF flows can overwhelm physical supply in the short term, creating price spikes. During the 2020 pandemic panic, ETF inflows were so large that physical gold shortages emerged, with premiums over spot prices reaching historic levels. This demonstrated that even in the modern era, physical gold supply constraints remain real.
ETF transparency also changed how investors analyze supply-demand dynamics. Holdings data updates daily, allowing investors to track whether gold is flowing into or out of investment vehicles. Rising ETF holdings suggest strong investment demand, while declining holdings suggest investors are rotating to other assets. My Gold Book explores these modern market mechanics in depth, helping readers understand how 21st-century financial instruments have altered traditional supply-demand relationships.
The psychological impact of ETF accessibility matters too. When buying gold requires only a stock market order, barriers to entry vanish. This democratization of gold ownership has increased retail participation in gold markets, amplifying demand volatility compared to earlier eras when gold ownership required physical storage and insurance.
Understanding gold supply and demand requires tracking multiple data streams simultaneously: mine production, recycling rates, central bank activity, jewelry demand, real interest rates, and geopolitical developments. These factors interact constantly, creating price movements that reward careful analysis and punish assumptions. My Gold Book provides comprehensive frameworks for analyzing these dynamics, helping readers move beyond surface-level price watching to genuine market understanding. Whether you’re building a long-term investment position or simply curious about how this ancient metal remains central to modern finance, mastering supply-demand analysis is essential. Explore the full analysis in My Gold Book to develop the systematic approach that separates informed investors from reactive traders.
Frequently Asked Questions
How do supply and demand affect the price of gold?
Gold prices move based on the balance between available supply and buyer interest. When demand exceeds supply, such as during economic uncertainty or when central banks increase purchases, prices typically rise. Conversely, when supply outpaces demand, prices tend to decline. Real interest rates, geopolitical events, and currency movements influence both sides of this equation, creating commodity volatility that investors monitor closely.
What are the primary drivers of gold demand?
Gold demand comes from four main sources: jewelry fabrication (roughly 50% of annual demand), investment purchases by individuals and institutions seeking safe-haven assets, central bank reserves as part of monetary policy, and industrial applications in electronics and dentistry. Investment demand often spikes during inflation concerns or geopolitical instability, while jewelry demand remains relatively stable year-round, making total demand a mix of both psychological and practical factors.
Does gold mining output significantly impact market prices?
Mining output affects gold supply, but prices respond to the entire supply-demand picture. Major mine production changes can shift market equilibrium, particularly when disruptions occur in top-producing regions. However, recycled gold (scrap recovery) and central bank sales also influence available supply. Price discovery happens through futures markets and OTC trading, where all these supply factors combine with demand signals to establish spot prices that reflect real-time market sentiment.
How does investment demand differ from industrial gold demand?
Investment demand, including bar and coin purchases, ETF inflows, and institutional capital flows, responds to inflation fears, real interest rates, and geopolitical risk. Industrial demand remains steady because manufacturers need gold for circuit boards and other applications regardless of price. Investment demand is far more volatile and can shift rapidly based on market sentiment, while industrial usage tends to grow slowly with economic activity, making investment demand the primary driver of short-term price swings.
This article was written using GrandRanker